
From the Lost Generation to Generation Alpha, every generational cohort has its stereotypical qualities.
Comparing Generations
Stereotypes are imperfect but sometimes useful. They can be used to make predictions or assumptions about large groups of people, but often fail when evaluating an individual.
Generational studies look at those born within the same general timeframe, having lived through the same major childhood events and nationwide economic flux. When these events occur at similar times of developmental or career stages, they can have a widespread effect on the group. Individuals within a generational cohort often share certain outcomes, like personality traits or consumer habits, due to these similar lived experiences.
Naturally, people vary for more reasons than their birth year. Regional and economic differences have massive impacts, as well as personal circumstances. Additionally, those born near the center of the age range in a cohort may be more likely to exhibit stereotypical traits, while those at the ends, or the cusps, may have very different lived experiences and thus different behaviors.
In some cases, microgenerations are formed at the crossover years between two generations, like Generation Jones, a microgeneration between Baby Boomers and Generation X.
Read: Generation X Bookends, From Generation Jones to Xennials
Caution:
It should be noted that blog posts like this are far from generational study material. I recommend visiting Pew Research Center or searching Google Scholar for genuinely informative data and discussion. This article on pewresearch.org explains how blog posts, among other things, affect real generational research. The information in this chart is just for fun. One should also note that it is tailored to the United States.
Curious about the generations of all the U.S. Presidents? Find a list here.
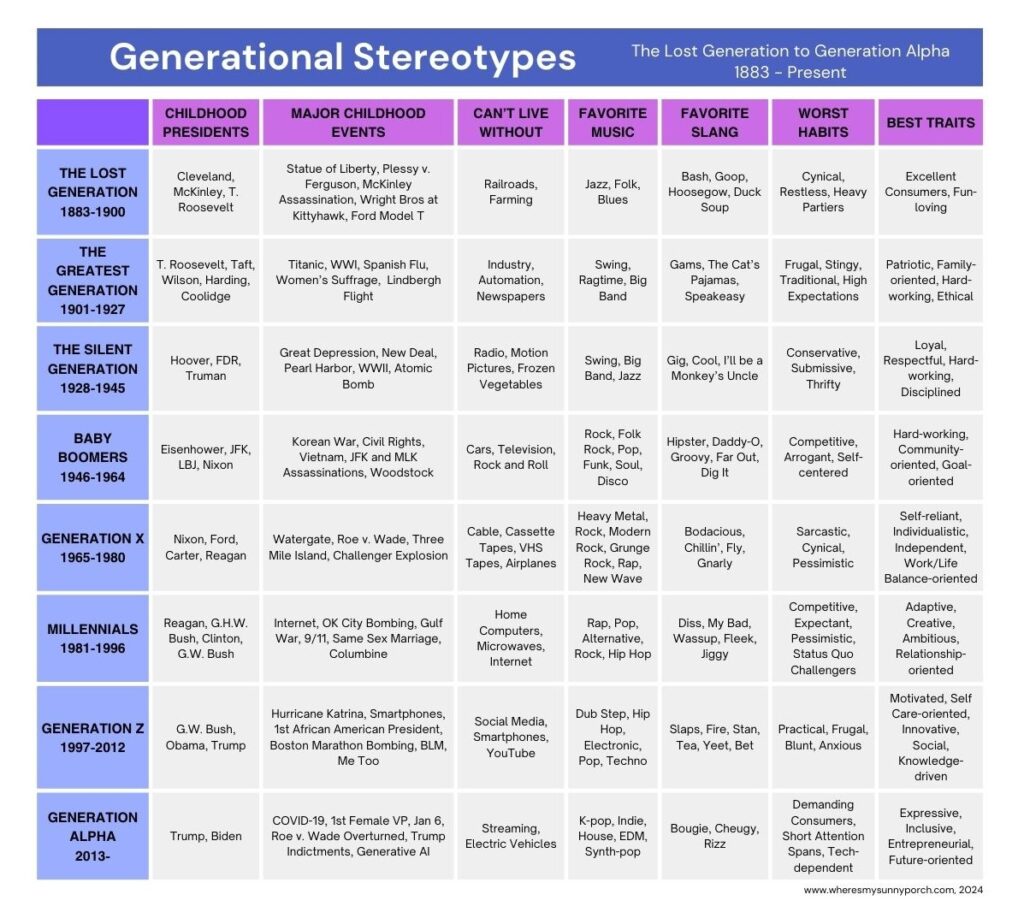
Generational Chart
That said, comparing generational stereotypes through a big-picture lens is a lot of fun!
I wanted a quick reference chart to keep track of major differences between generations, and I decided to share it here. Enjoy!
If you enjoy just-for-fun-generational stuff, try this short Scooby-Doo-style mystery story that pokes a little fun at some classic stereotypes here.
If you see any errors in this chart or would like to start a discussion, leave a comment!
Go to the Home page to read much more about generational cohorts, Generation X in particular.